Want to know more? Click on the links below to learn more about the features of
DragStat; the premiere drag racing log book and ET prediction software.
|
|
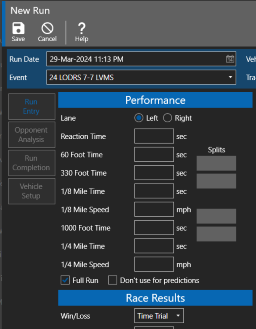
Enter Run Data
You can enter all of your run data into DragStat including elapsed times (ET) and
speeds, weather conditions, elimination results, car setup parameters, event data,
track information, and other observed car and track data.
Entering run data is easy and normally takes less than a minute. You can enter as
much or as little information as you like. Only a handful of information is required
for each run. If your car setup parameters have not changed from your most recent
run, the parameters will be carried over to new runs entered. This not only saves
time but it also reduces data entry errors.
When entering time slip data, you do not have to enter any decimal places as DragStat will enter them for you. This saves time and reduces data entry errors. |
|
|
Predict ET and Throttle Stop
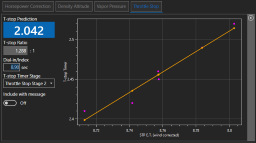
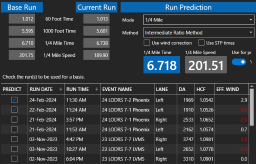
The most powerful feature of DragStat is its ability to predict your performance
based on your previous runs along with the current weather conditions. You can predict
elapsed times or throttle stop settings based on sets of runs that you choose. DragStat shows you the selected runs and the prediction on a chart. This chart serves as a visiual aid in selected "good" runs to use for the prediction.
You can even estimate your 60 ft time and DragStat will automatically change the prediction based on the 60 ft factor that you control.
If you utilize a supported weather station, you can get up to the minute predictions
as you watch your prediction change with changes in the weather conditions. Whether
you utilize a throttle stop or run all out, DragStat can help you predict your elapsed
times.
Additionally,
you can predict the elapsed time and speed on runs where you hit the brakes before the finish line using the run completion
feature.
 Top
Top
|
|
|
|
Track Multiple Vehicles
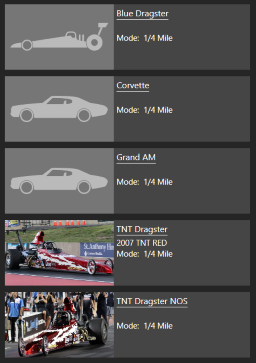
A DragStat exclusive feature. If you race more than one vehicle, you can keep track
of the runs for each vehicle in the same log book. DragStat helps you keep runs from
multiple vehicles separate from one another when calculating predictions and other functions.
Independent predictions can be made simultaneously for each vehicle without needing
to reconfigure the system for the other vehicle.
You can also add an image for each vehicle that will get used throughout DragStat's other pages. This helps you easily identify what car you are entering data for plus it's fun.
 Top
Top
|
|
|
Weather Analysis and Calculations
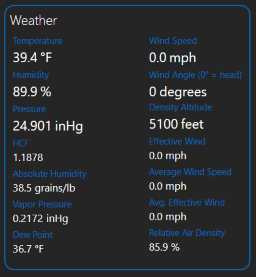
DragStat tracks and calculates the weather conditions for each run in your log book.
All you need to do is enter the temperature, humidity, barometric pressure and wind conditions and
DragStat provides the weather calculations listed below.
- Density Altitude (DA)
- Horsepower Correction Factor (HCF)
- Vapor Pressure (VP)
- Relative Air Density
- Absolute Humidity (Water Grains)
- Dew Point Temperature
- Effective Wind
- Wind Direction
- Average Wind Speed
DragStat corrects your elapsed times to standard weather conditions (STP) based on the
weather data that you enter for each run. This means that you can factor out the
differences in weather between runs for a more accurate comparison.
 Top
Top
|
|

|
Compatibility with Popular Weather Stations
DragStat interfaces with many popular weather stations and paging systems (see list
below). DragStat logs current weather conditions throughout the day and automatically
displays them with the weather calculations mentioned above. If you utilize a supported
weather station, DragStat also makes it easy for you to enter weather data for each
run. Just enter the time and date of your run and the weather conditions are automatically
entered.
The DragStat software can be setup to utilize
paging transmitters built in to some weather stations as well as stand alone paging
transmitters. Page messages are configurable and typically contain an ET or throttle
stop prediction and the current weather data. Page messages are then sent from DragStat
to your pager.
DragStat Compatible Weather Stations
- Altronics PerformAIRE Weather Center
- Altronics PerformAIRE PC with paging
- Altronics PerformAIRE Pro with or without paging
- Altalab AltaComII trailer based weather station
- Altalab ACom 4x weather station
- AltaLab ACom 4xR paging weather station
- Computech RaceAir Remote
- Davis Instruments Vantage Pro and Vantage Pro2
- Davis Instruments Vantage Vue
- WeatherFlow Tempest
 Top
Top
|
|

|
Page/Text/Email Messaging
In addition to sending page messages, DragStat software can also send text or email
messages to your cell phone. Simply configure your phone number and/or email address
in the software. Text messages can be send alone or in conjuction with pager messages.
This feature works great for those times when you are too far from your paging transmitter
to receive page messages.
DragStat software supports all messaging methods for multiple vehicles simultaneously
(a DragStat exclusive). DragStat software can send messages for as many vehicles or
configurations as you like. For example, lets say your family races two cars in
the same category. You can configure two DragStat prediction pages (one for each
car) and send prediction messages from each one before leaving the trailer. Each
page will send its own prediction at predetermined intervals so that you will
receive alternating pages; one for car number one and another page for car number
two.
You can also configure DragStat predictions based on any run data in your log book.
Let's say you see a difference between the right lane and the left lane. You can
create a prediction page for each lane and send both predictions to your pager
at the same time. There is no limit to the number of prediction pages or configurations.
 Top
Top
|
|
|
Run Comparison™
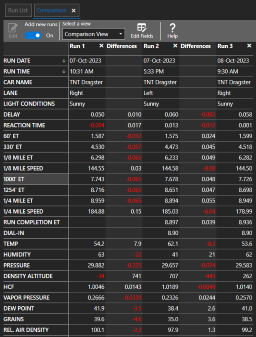
Any set of runs can be selected and compared side by side similar to paper log books.
DragStat software automatically calculates the differences between the runs and displays them next to each run.
Any field of information can be added to or removed from the comparison view. New runs entered can be automatically
added to the comparison window. This is an invaluable tool to detect inconsistencies between runs.
 Top
Top
|
|
|
Dashboard
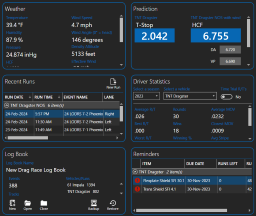
The Dashboard is the home page of DragStat and is a useful tool in summarizing the data in your log book.
The Dashboard page displays current weather conditions, a summary of your log book,
the last saved predictions, driver statistics and maintenance reminders.
You can even create a backup of your log book from the dashboard in case of computer failure.
 Top
Top
|
|
|
Driver Statistics
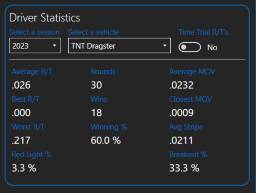
The Driver Statistics card on the Dashboard shows reaction time, winning percentage and margin of victory
(MOV) statistics for each season and each vehicle in the log book. The data is taken from
the run data entered for each run and you can choose whether to use time trial runs for reaction time data.
 Top
Top
|
|
|
Run Split Time Analysis
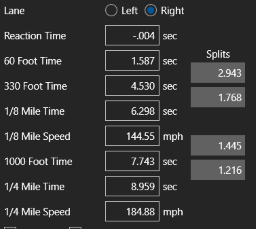
DragStat software automatically calculates the differences in your incremental times
(i.e. 60 foot to 330 foot time). After entering a run into the log book, you can see these time differences.
This is useful to detect variability between runs and to help you solve inconsistency problems.
You can also
see the split times corrected to standard weather conditions known as standard temperature and pressure (STP) using the STP Split Times view.
 Top
Top
|
|
|
Run Filtering
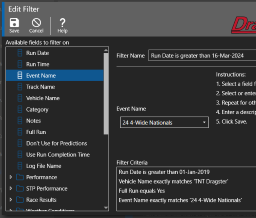
Run filtering is an easy to use feature that allows you to select a subset of runs
for viewing, predictions, comparisons, etc. This powerful feature is a must when
dealing with multiple runs in differing conditions. No need to move runs around
into different log books or "combinations". Just create a filter to find the runs
that you want.
For example, say you want to see all the runs of your Super Gas car from a particular
event. Just create a filter by selecting the event and the car as the criteria.
Save the filter and the runs that meet the criteria are immediately shown. Or, maybe
you want to see all of the runs made under certain weather conditions. Simply create
a filter by selecting the desired weather parameters and enter the range of values
to search on for each parameter. The possibilities are endless.
 Top
Top
|
|
|
Track Maintenance Items
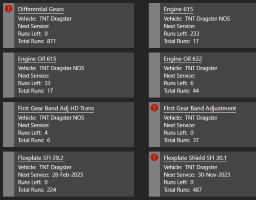
Maintenance items relate to components on your race car or cars that you wish to
track for scheduled preventative maintenance. Things like oil changes, engine freshening,
and tire rotations can all be entered and tracked as maintenance items. There is
no limit to the number of items that you can track and you have full control over
what items are added.
DragStat software keeps track of the date that you installed or serviced an item
as well as the number of runs for each item and notifies you when the item is due
for servicing. You can select to be notified by date or by number of runs.
 Top
Top
|
|
|
Viewing Run Data
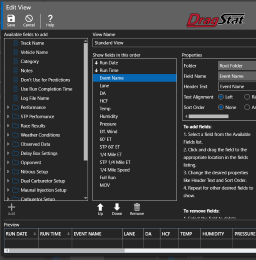
Views are used to display run data in a tabular listing where each row represents
a run and each column represents a field of data related to the run. Views allow
you to see the run information for each run that most interests you together on
the screen for ease of making comparisons between runs or for selecting runs to
be used in predictions.
Several predefined views are included, but you can create custom views for your
needs. Each view allows you to define the sort order of the data and the data format
such as number of decimal places, right or left alignment, etc.
Additionally, you can choose to view the run listing as rows or as columns similar to how paper log books are organized.
 Top
Top
|
|
|
Record Vehicle Setups
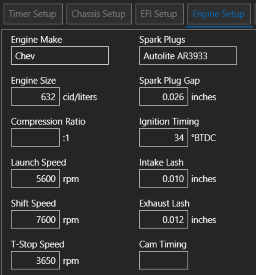
Along with every run that you enter, you can also record your vehicle's setup parameters.
Items like tire pressure, ballast, carburetor jets, etc. can all be recorded.
To make it easy to enter car setup information, DragStat carries the information
from previous runs forward on every new run. All you have to enter are the changes
to your setup.
 Top
Top
|
|
|
Opponent Analysis
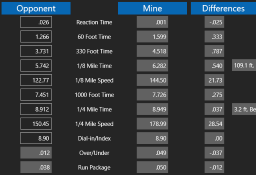
DragStat software allows you to track your opponents and their reaction and
elapsed times as well as notes about the race. You can then use the
opponent anaysis screen to see how much stripe you or your opponent took. The
analysis screen also gives your total package and the time and speed differences
between you and your opponent.
 Top
Top
|
|